Notes on charts
Notes help you track important events and related changes in your app statistics. You can find them in AppMetrica reports and in Chart widgets in workspaces.
Creating notes
You can create notes only in reports. One app can have up to 5000 notes.
Each note is associated with a specific date and time.
For convenience, notes can be assigned to one of five groups. This allows you to view notes related to specific topics and temporarily hide the rest. The groups are labeled with the Latin letters A, B, C, D, and E. They can't be renamed.
To create a note:
-
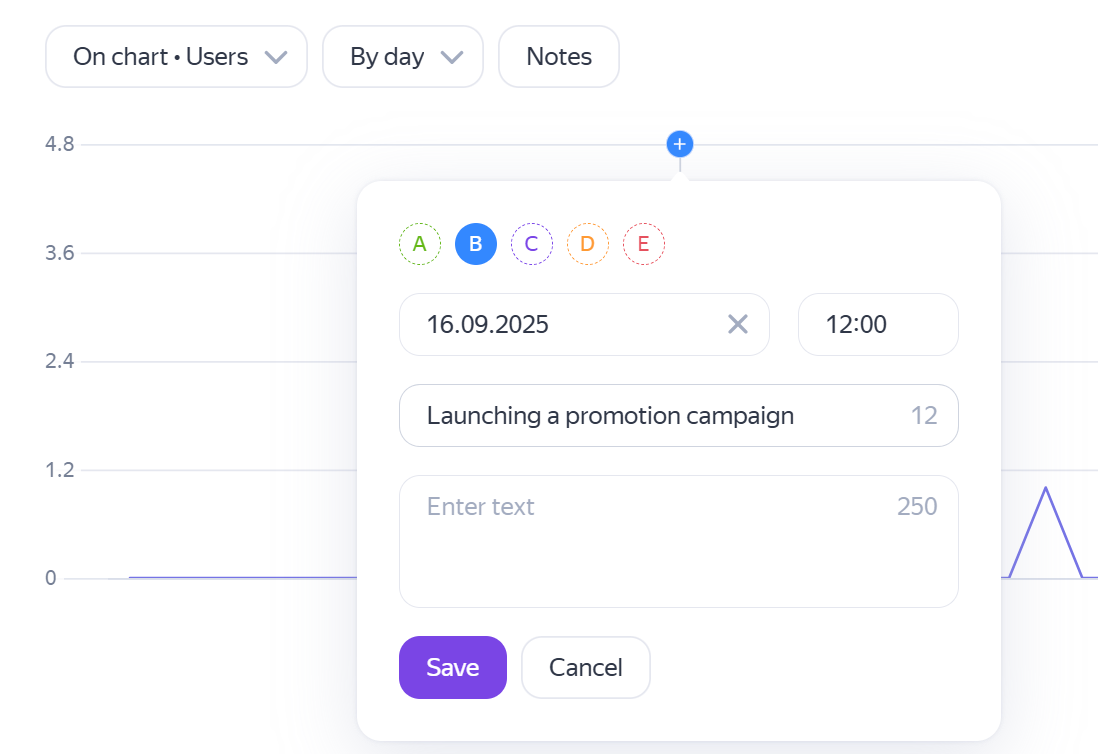
Find the desired date on the timeline and click the corresponding point on the chart. The note creation window opens.
-
If needed, select a group to assign the note to: A, B, C, D or E. By default, group A is selected.
-
Check and, if necessary, adjust the date and time of the note. The default time is 12:00.
-
Enter a short name for the note. If needed, add a detailed description.
-
Click Save.
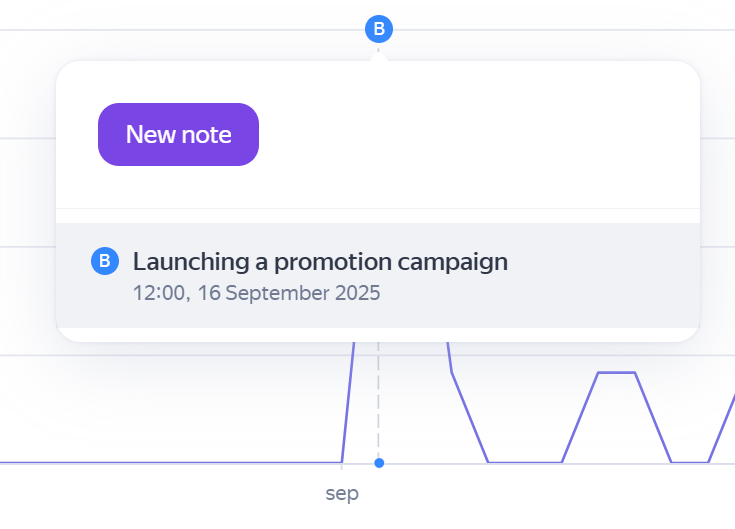
The chart will show the icon of the newly created note as the letter corresponding to its selected group.
Viewing notes
To view the note text, hover over the vertical line corresponding to its date and time.
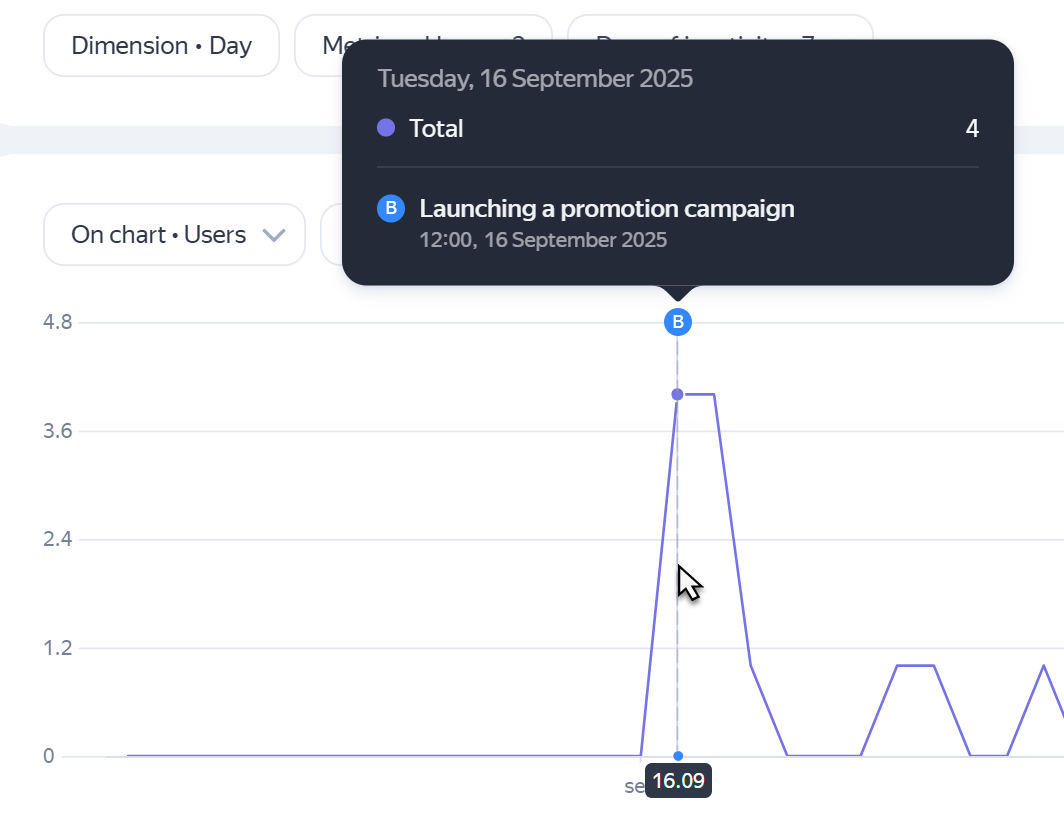
If multiple notes are associated with the same or nearby points on the chart, their text can be displayed within the same window. The proximity of points depends on the selected time period and the chart's scale.

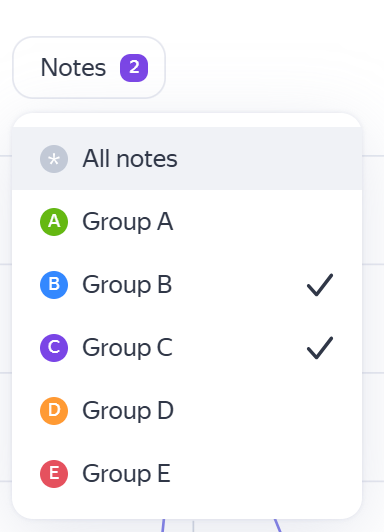
You can choose to display all notes, only specific groups, or hide all notes.
Your notes are retained when switching between line chart and bar chart views. Notes aren't displayed in pie chart view.
If you didn't find the answer you were looking for, you can use the feedback form to submit your question. Please describe the problem in as much detail as possible. Attach a screenshot if possible.